
After the stormMonitor
Tree loss reports
A written count and value of every storm-damaged tree, mapped by area, so the board, the insurer and the replanting budget all start from the same number.
- Storm-damaged trees counted
- 998
- Area maps, one per hole or area
- 21
- Pages in the final report
- 24
- Surveys in the set
- 5
From the field
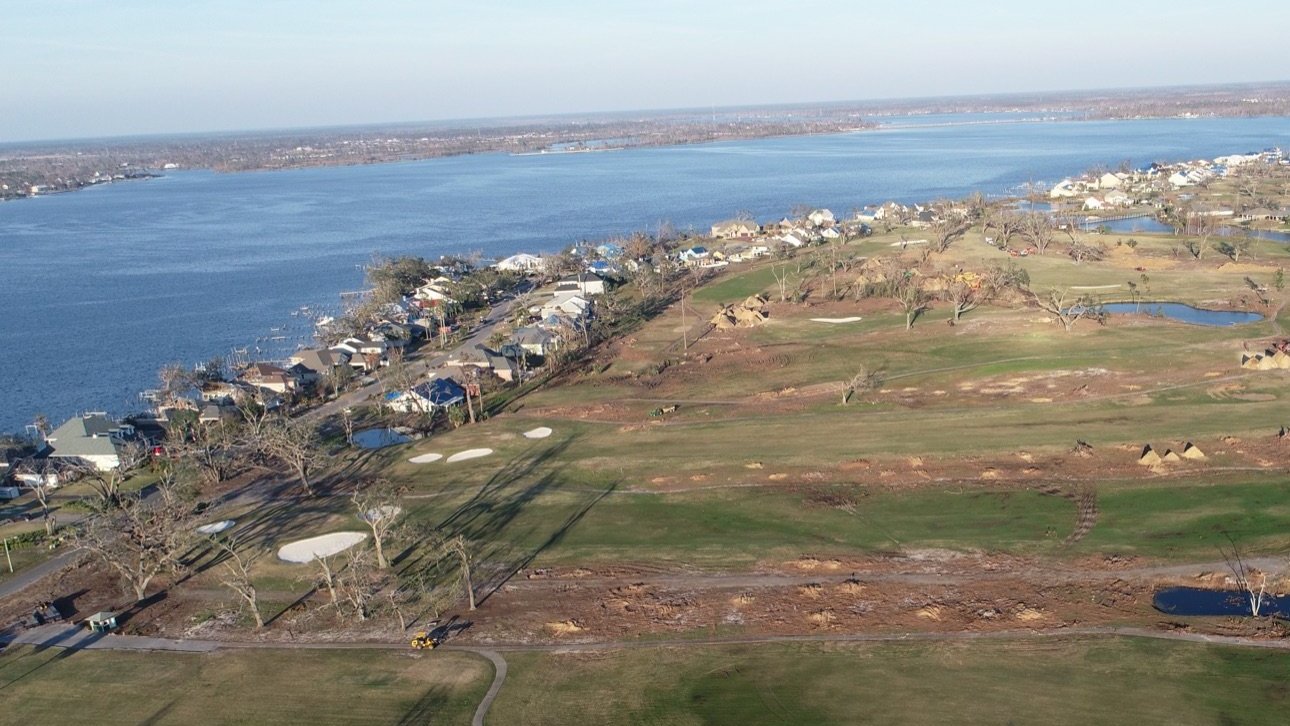
Nearly 1,000 trees on one golf community, counted and valued.
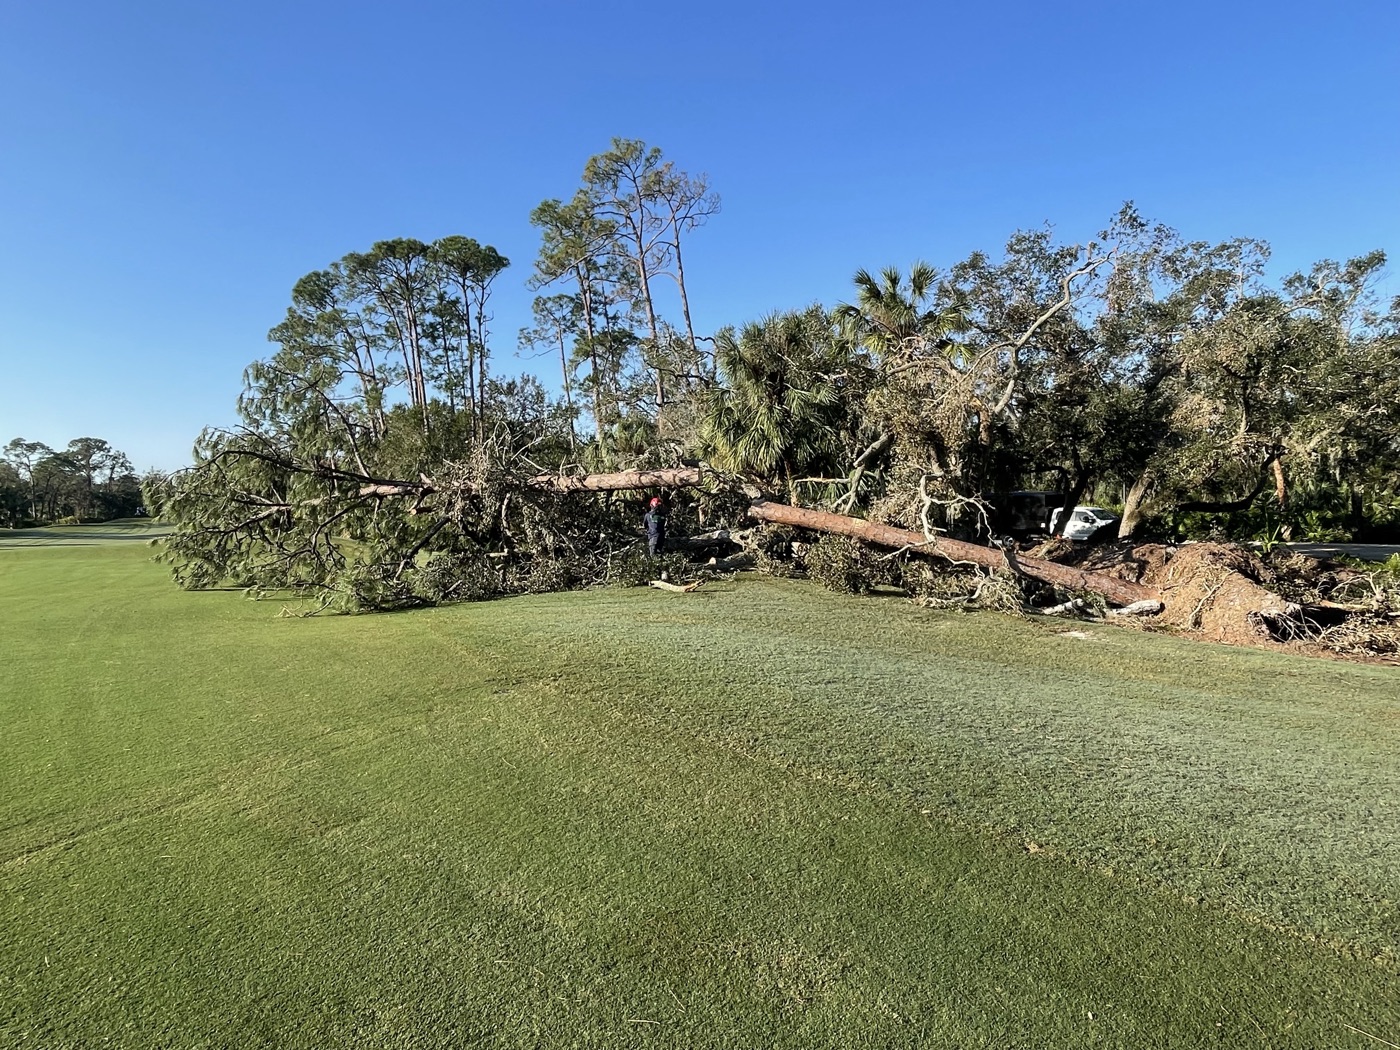
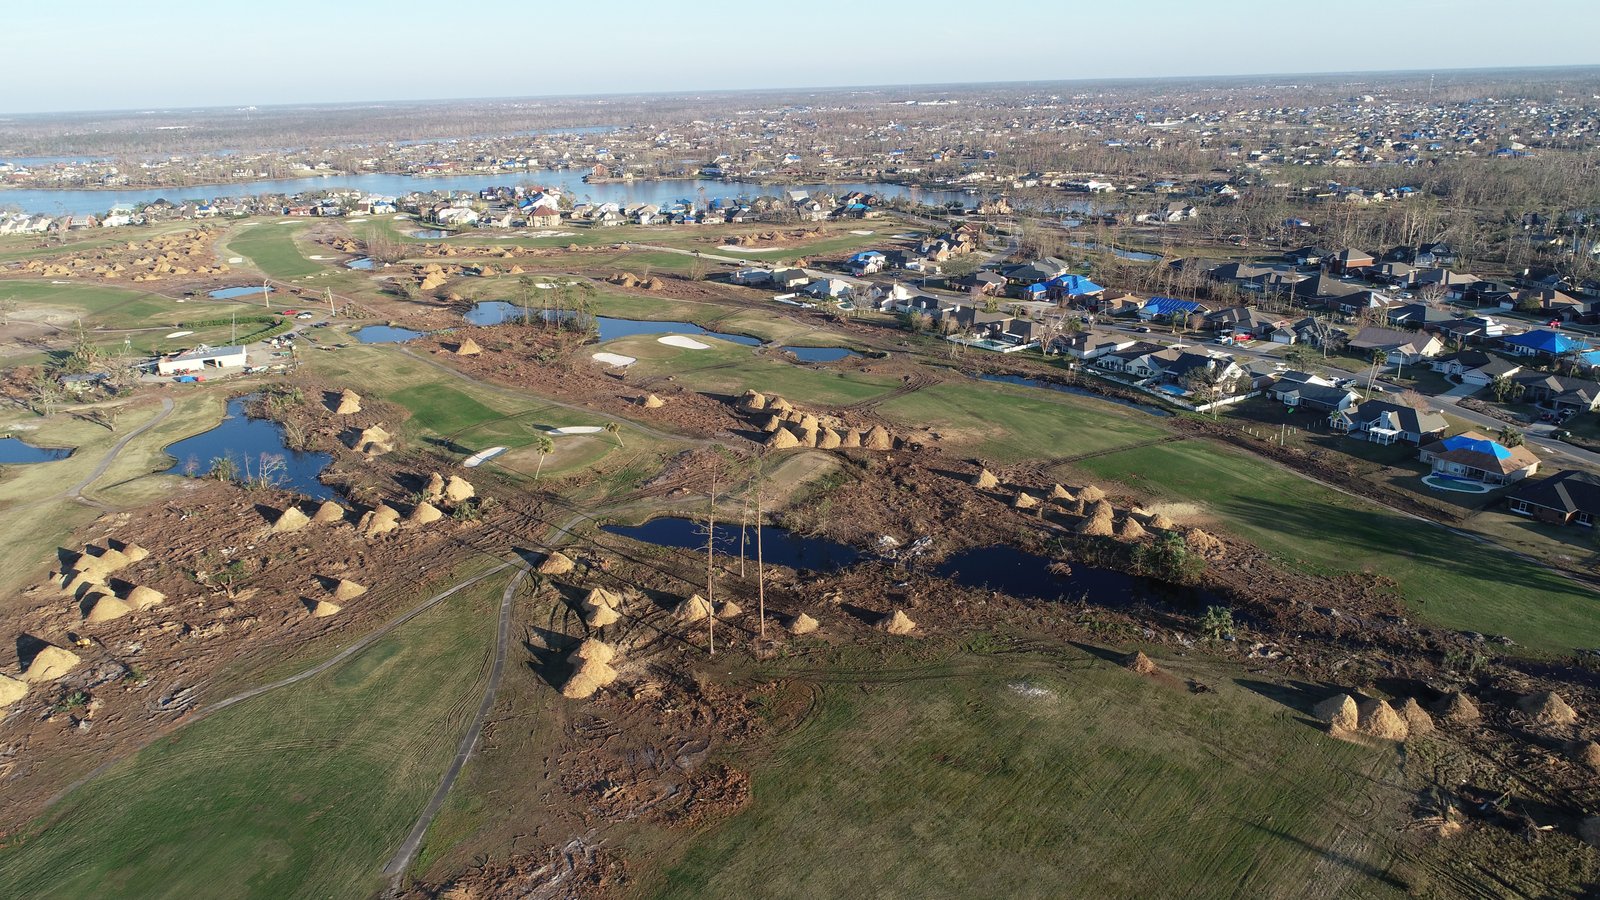
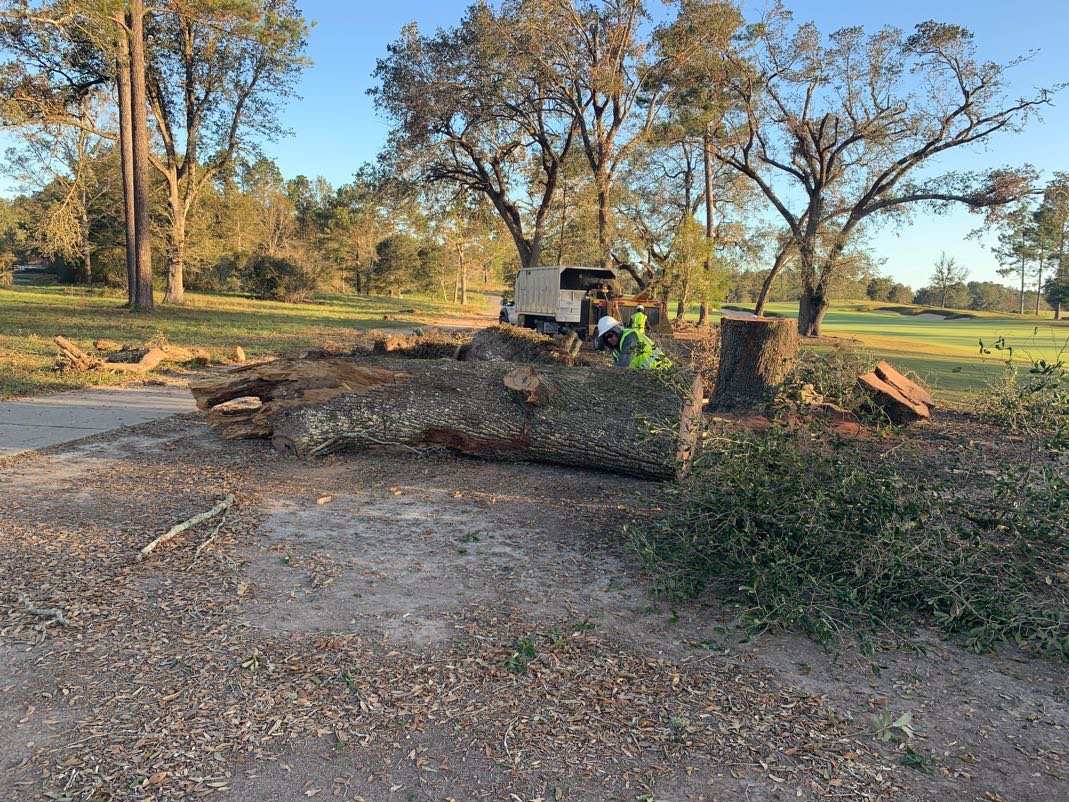
After a hurricane, Jeff Kaulbars led a 24-page tree loss and replacement evaluation for a golf community: every storm-damaged tree on 18 holes, the practice areas and the entry, by species and size, with a map for each area. The numbers above come from that report. The set ran to 5 surveys, with hazard, leaning, distressed and pruning.
What is in the report
Six parts, one number everyone can use.
Which trees are included (storm damage only, preexisting damage excluded), the level of assessment, and the market date the values are tied to.
Every storm-damaged tree counted by species and size class (trunk diameter for trees, overall height for shrubs), area by area.
A per-tree material value for each species and size class at current market value, totaled by class and by area.
The same trees valued with installation included, so the number reflects what it costs to put a comparable tree back in the ground.
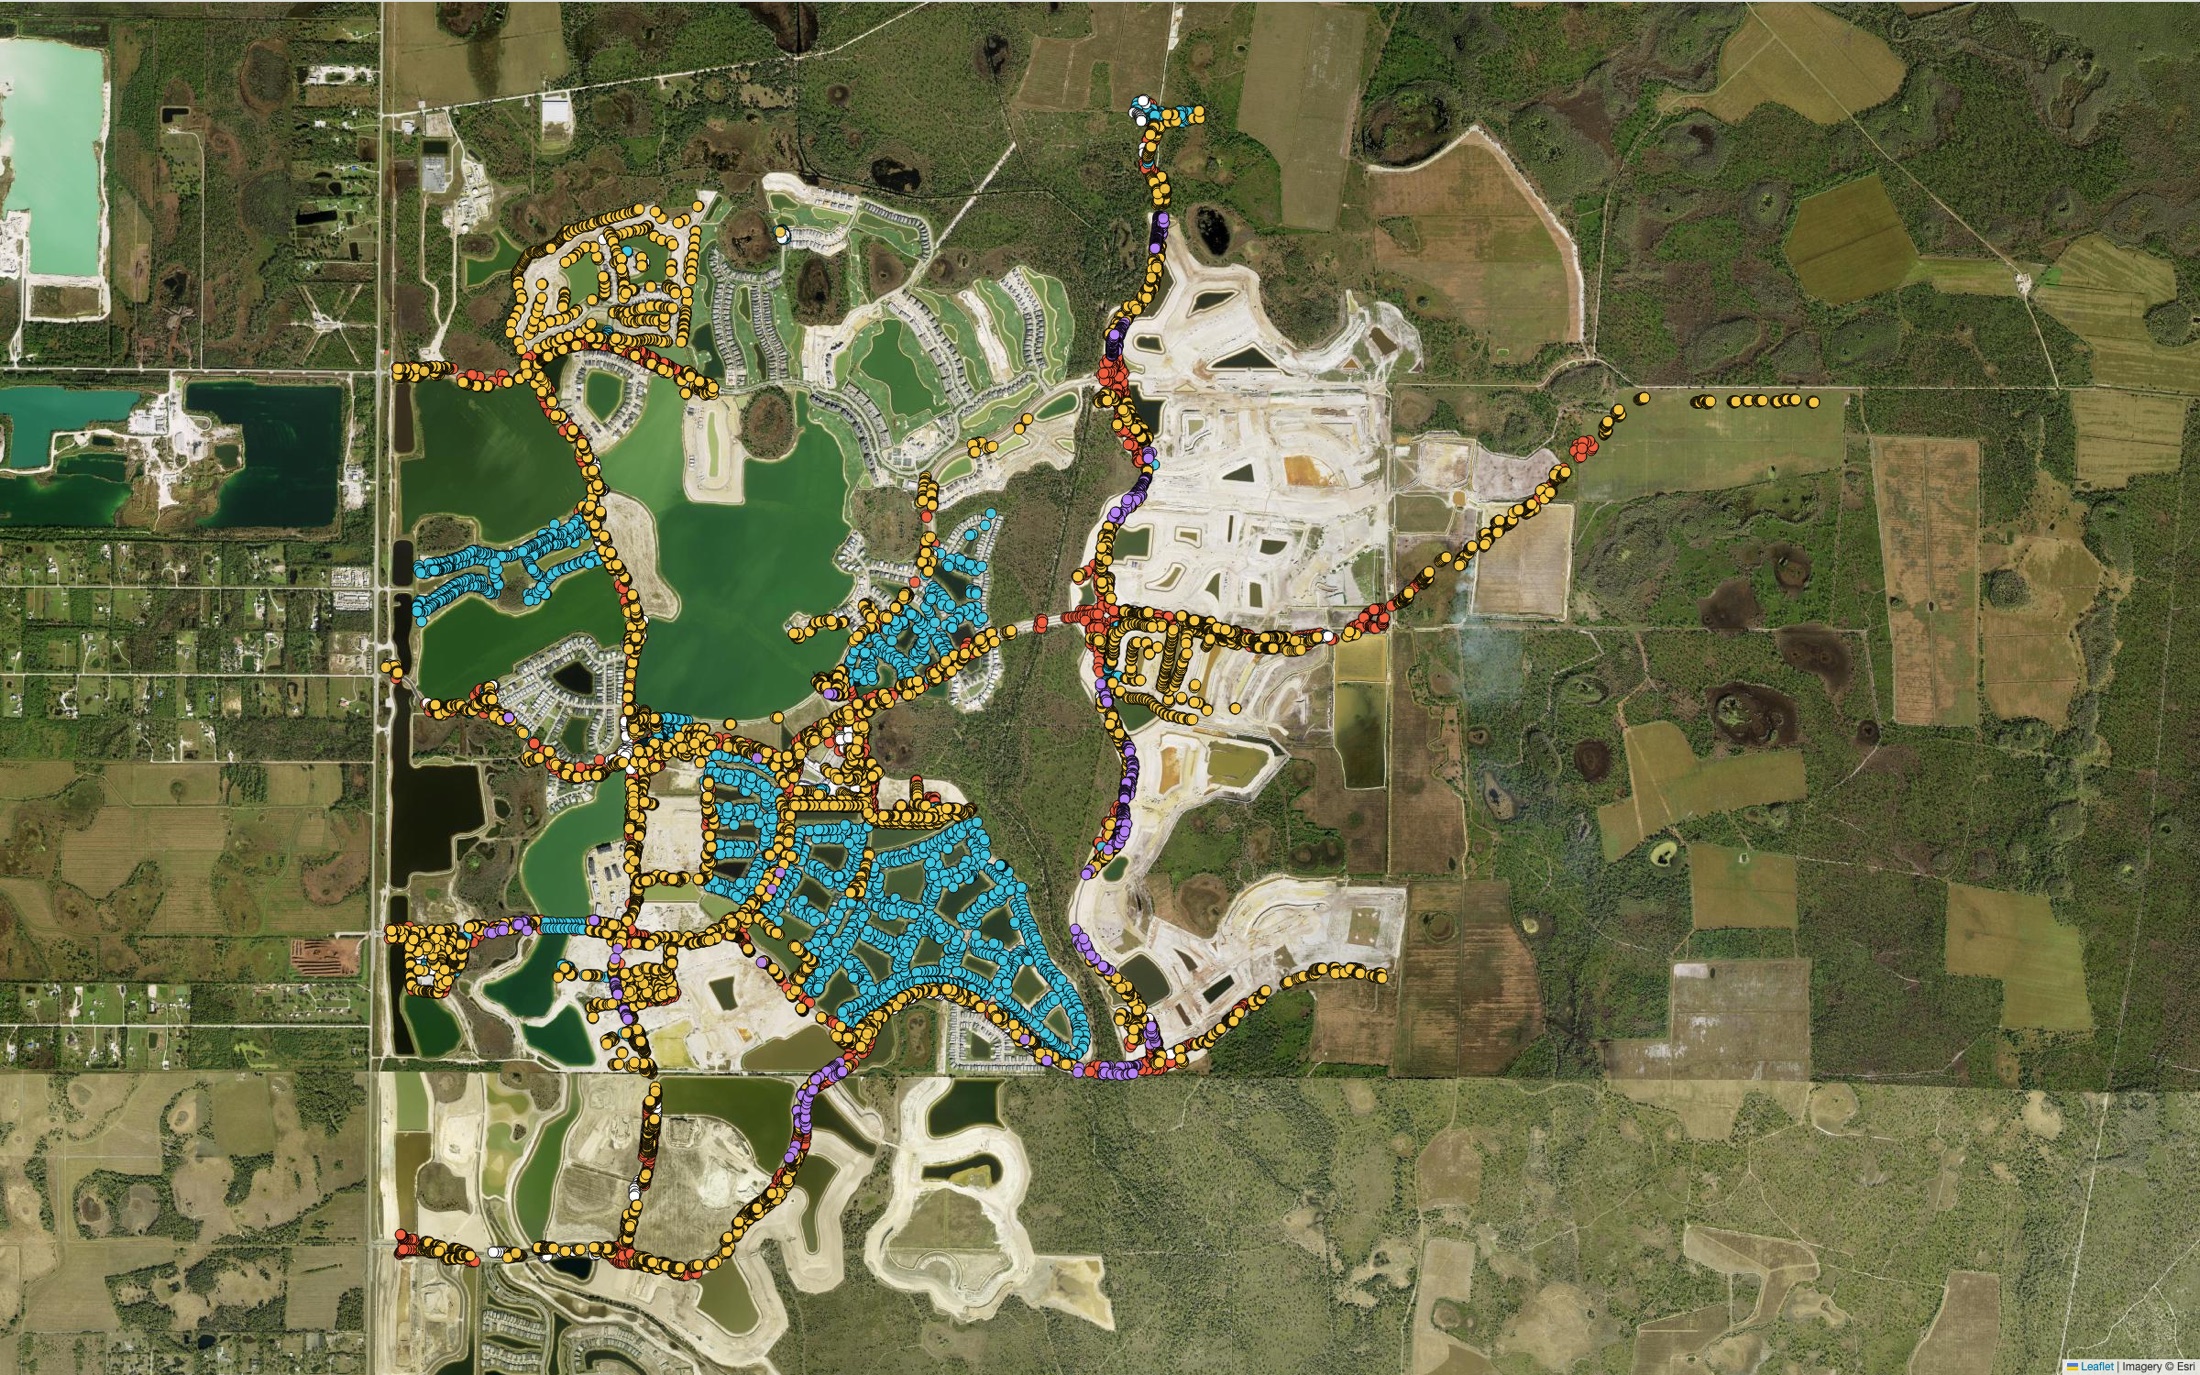
One aerial map for each area, with every tree pinned by GPS and color-coded by species and size.
As the property needs them: hazard trees within striking distance of a target, leaning trees, distressed trees that may still decline, and corrective structural pruning.
How we build it
Counted in the field, valued at today’s market.
A tree loss report is a record, not a proposal. It tells you what was lost and what it costs to replace, so decisions about claims, budgets and replanting rest on numbers.
- 01
A certified arborist walks the property and identifies the storm-damaged trees.
- 02
Each tree is recorded with its GPS point, species, size and area.
- 03
Trees are grouped into species and size classes and counted area by area.
- 04
Each class is valued at the current market date, as material cost and as replacement with installation.
- 05
Totals roll up by class, by area and for the property.
- 06
An aerial map is drawn for each area, and recounts are reconciled before the report is final.
After a hurricane
Know what you lost before you file, budget or replant.
We count, map and value every storm-damaged tree on the property.